








































Key Takeaways
- Warm rooms slow students down without raising their error rate, so a degraded classroom learning environment goes unnoticed by the people sitting in it.
- PSAT data on 10 million retakers ties each extra degree of school-year heat to a 1% learning loss where there is no cooling.
- Measured indoor temperature tracked the weather only weakly. A room's thermal state is a facilities outcome.
- One monitored district supplied roughly half the outdoor air per student that ASHRAE asks for.
- Fixing airflow and temperature together modeled out to 138 points on math scores, against a 114-point gap to "commended performance."
- Free-lunch-eligible students were in the hotter, staler rooms on average.
When Danish researchers pushed classroom temperatures from 68°F to 77°F (20°C to 25°C) and measured how children handled schoolwork tasks embedded in their normal lessons, the students did not make more mistakes. They got slower. Speed across eight task types fell by about 1.1% for every 1°F of added heat, while error counts held steady.
That single result explains why the problem survives for decades in the same building. A teacher in a warm room sees a class that is dragging, not a class that is failing. The loss only surfaces when someone pools thousands of students across hundreds of rooms, which is what research on the classroom learning environment has been doing since the 1960s.
Two variables carry most of the effect. One is temperature. The other is how much outdoor air reaches each student's breathing zone. Neither costs much to measure, and in most school buildings neither is measured at all.
All You Need to Know About the Classroom Learning Environment
- How Does Classroom Environment Affect Learning?
- Classroom Temperature Depends on the Building More Than the Weather
- What CO2 Levels Say About Classroom Air Quality
- Ventilation and Classroom Temperature Together Moved Math Scores 138 Points
- Low-Income Students Sit in the Hottest, Least Ventilated Classrooms
- Why School Buildings Degrade the Classroom Learning Environment
- Building an Effective Learning Environment in the Classroom Starts With Measurement
- FAQ
How Does Classroom Environment Affect Learning?
Research on the classroom environment and its impact on learning splits two ways.

Controlled studies manipulate one variable and watch task performance inside the same week. A Kansas State chamber study from the late 1960s ran six-student groups through simulated schoolwork at temperatures from 62°F to 92°F (17°C to 33°C) and found a trade-off nobody expects. Error rates came out lowest at 80°F and highest at 62°F, yet students worked most slowly at 80°F and about 10% faster at 68°F. Warmth buys care and costs pace.
Thirty-six students is a thin base to build on. The result has held up mainly because later work kept pointing the same way, including David Wyon's studies from the same period, which found reading speed and comprehension falling by as much as 30% at 81°F compared with 68°F.
Observational studies ask the blunter question of what happened to real outcomes across real buildings. Park, Goodman, Hurwitz and Smith, writing in the American Economic Journal, matched 10 million PSAT retakers against the weather in the school years before each sitting. Without air conditioning, a school year 1°F hotter than the previous one reduced that year's learning by 1%. Weekend and summer heat did almost nothing, which points at disrupted instructional time rather than general fatigue.
|
Classroom temperature |
What the research reports |
|
68°F (20°C) |
Fastest work pace in chamber testing, and the floor of the comfort zone ASHRAE 55 drew for winter clothing |
|
68–77°F (20–25°C) |
Task speed drops about 1.1% per 1°F; error rate stays flat |
|
73–79°F (23–26°C) |
The zone ASHRAE 55 drew for summer clothing, sitting above where classroom field studies measured their best results |
|
81°F+ (27°C+) |
Reading speed and comprehension decrements as large as 30% versus 68°F |
Those comfort bands come from an older edition of ASHRAE 55 and get quoted far more often than they get checked. The current standard predicts comfort from clothing, activity, air speed, and outdoor conditions rather than publishing a fixed table.
No two studies land on the same ideal number, though the direction has been consistent for sixty years. A 2025 scoping review in Environments puts the aggregate magnitude at roughly a 20% gain in task speed when a room drops from 86°F to 68°F (30°C to 20°C), with an optimum below 72°F (22°C) for children in temperate climates. College students in Seoul tested best several degrees warmer.
Classroom Temperature Depends on the Building More Than the Weather

Monitored classrooms barely tracked outdoor conditions. Across 140 fifth-grade rooms in 70 schools, a 2015 PLOS One study put the correlation between average indoor and average outdoor temperature at a weak 0.243. Dropping outdoor temperature into the models changed almost nothing.
The finding has limits. The monitoring covered one southwestern district with mild winters, ran from late January to mid-April, and kept windows closed under district policy. It does not say a September heat wave leaves a classroom untouched.
The PSAT work says the opposite at national scale, and each applies somewhere different. Outdoor heat drives the room wherever cooling is absent or beaten. Where the equipment works, the number on the wall records how somebody set it, and the same three failures turn up over and over.
- Setpoints left wherever the last person to touch the remote put them
- Central schedules that run to the calendar instead of to which rooms filled up
- Units cycling away in an empty room while an occupied one three doors down sits at 80°F
That distinction matters for anyone deciding where to spend, since you can budget for operating practice and you cannot budget for August. Regulation has started to catch up in places, though classroom temperature law is still a patchwork of state and district rules rather than a single ceiling anyone can plan against.
What CO2 Levels Say About Classroom Air Quality
Students exhale CO2 at a predictable rate. Measure the concentration in an occupied room and you can back out how much outdoor air each person is getting. Around 1,000 ppm indicates ventilation roughly in line with the standards. Occupied classrooms frequently run at double that.
The EPA's own position is blunt. Children in classrooms with higher outdoor-air ventilation rates score higher on standardized math and reading tests than children in poorly ventilated rooms.
ASHRAE Standard 62.1 puts classrooms for ages nine and up near 13 cfm per person at the density it assumes. The district study measured a mean of 3.6 L/s per person, about 7.6 cfm, against the 15 cfm floor in the edition current when they took the readings. Fifteen of the 70 schools ran fan coil units that heated and cooled the rooms while supplying no outdoor air at all.
What that shortfall costs has been measured several ways.
|
Change in outdoor air supply |
Measured effect on students |
|
+2.1 cfm (1 L/s) per person, within the substandard range |
2.9% more students passing math, 2.7% more passing reading |
|
Doubling the supply rate |
About 8% faster completion of schoolwork tasks |
|
1.7 to 6.6 L/s per person |
3.2% to 7.4% more correct answers across four tests, error rate unchanged |
Those pass-rate figures carry confidence intervals running from under 1% to nearly 5%, so the direction is firm and the size is not. Across a review of 11 studies, eight reported meaningful gains with better ventilation, typically a few percent and occasionally as high as 15%.
Error rates hold steady while output rises, the same signature heat leaves behind.
The mechanism is less settled than the effect. Researchers tested illness absence as the pathway and could not confirm it, which points toward air acting on students while they sit in the room rather than through days lost to sickness.
That reading is an inference from a null result, not a demonstrated finding. Other work cuts the other way, tying each extra liter per second per person to roughly a 1.6% drop in illness absence. Both routes are probably live, and both get read from the same instrument, which is why indoor air quality monitoring for schools starts with a sensor in the occupied room rather than a survey of the plant.
Ventilation and Classroom Temperature Together Moved Math Scores 138 Points
The two get studied apart more often than together, which understates the combined result. In the multilevel model built on those 140 classrooms, both carried independent weight.
|
Model input |
Estimated effect on math score |
|
Ventilation rate |
74 points |
|
Indoor temperature |
64 points |
|
Both together |
138 points |
|
District average, as measured |
2,286 points |
|
Threshold for "commended performance" |
2,400 points |
The gap to clear was 114 points. Nothing in that model changed teaching, staffing, or curriculum.
The study is observational, so it establishes association rather than proof of cause, and the authors say so plainly. And the widely cited Harvard COGfx results, where cognitive scores doubled under enhanced ventilation, came from adult office workers in a simulated environment, not from children in classrooms. Classroom effects run smaller than the office-lab headline numbers, and anyone quoting the doubling figure at a school board meeting is quoting the wrong study.
Low-Income Students Sit in the Hottest, Least Ventilated Classrooms
Sort the same 140 classrooms by student demographics and the environmental data stops looking random. African American and Hispanic students, and students eligible for free or reduced lunch, were on average in rooms with lower ventilation rates and higher temperatures.
The authors flagged that as a possible equity issue and said their sample was too small to chase it further. The subgroup numbers are noisy in both directions, and for two groups the temperature association ran the other way and missed significance. Worth knowing before anyone builds a policy argument on one district.
The PSAT work found the same shape at national scale. Hot school days hit minority students harder, and the authors attribute roughly 5% of the racial achievement gap to which buildings got cooling.
Why School Buildings Degrade the Classroom Learning Environment

Two separate failures do the damage, and schools routinely treat them as one. The first is hardware, and the federal survey behind the 2020 GAO report put numbers on that backlog.
- 41% of districts need HVAC updated or replaced in at least half their schools
- That works out to roughly 36,000 schools nationwide
- 54% of districts need multiple building systems replaced, not just one
- Security, technology access, and health-hazard monitoring came back as the top-named facility priorities
Some districts told GAO plainly that they were funding security ahead of building systems like HVAC.
Then there is the operating layer sitting on top of the equipment. In that 70-school district, 76% of classrooms did not open windows on a daily basis, partly because district policy discouraged it in favor of relying on the mechanical systems. Those mechanical systems were, on average, delivering half the air the standard asks for. Nobody was checking, because checking requires instruments in rooms and somebody reading the output.
The second failure costs far less to fix, which is why the conflation is expensive. Fisk put the incremental energy and capital cost of bringing school ventilation up to standard at a few dollars to roughly ten dollars per person per year, under 0.1% of United States spending on public elementary and secondary education. Separating them is a school facility management question long before it becomes a procurement one, and the hardware half turns on the choice of AC systems for school buildings.
Building an Effective Learning Environment in the Classroom Starts With Measurement
Most schools hold no per-room history of temperature or CO2, so every conversation about comfort runs on complaints and memory.
Four steps get a district from anecdote to something it can act on.
- Instrument a sample of rooms first. Continuous logging in a dozen representative classrooms for a few weeks tells you more than a district-wide guess, and it costs far less than wiring up every room before you know what you are hunting.
- Look at occupied hours only. Overnight and weekend readings flatter the data and describe conditions nobody learns in.
- Separate the rooms that are hot from the rooms that are stale. Different fixes, different budgets.
- Give the setpoint an owner. Rooms without a defined schedule drift toward whatever the last occupant wanted.
Two numbers read together tell you which problem you have.
|
Room reads |
Diagnosis |
|
79°F, 700 ppm CO2 |
Control problem. Fresh air is arriving, the setpoint is wrong |
|
71°F, 2,000 ppm CO2 |
Airflow problem. Temperature is handled, outdoor air is not |
|
79°F, 2,000 ppm CO2 |
Both, and usually a unit that has quit doing its job |
An indoor air quality monitor for schools earns its cost at the point where it changes a decision. Reading 1,900 ppm in a room that was scheduled to be fine tells a facilities lead exactly which unit to inspect, instead of sending a technician to walk the whole building.
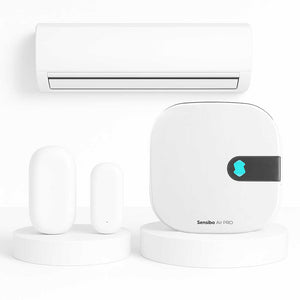
Control is the half that changes the classroom learning environment rather than describing it. Plenty of schools run on split systems and packaged units driven by infrared remotes, and retrofitting controllers onto those gives a facilities team four things at once.
- Scheduling that follows the timetable instead of the caretaker
- Setpoint limits per room, so nobody can park a classroom at 64°F
- Occupancy-driven operation, so empty rooms stop being conditioned
- A record of what every room did all term
The Interamericana University of Puerto Rico went this route to get visibility on classroom air. The ORT educational network reports a 28% reduction in AC bills after centralizing control, a figure from their own deployment rather than an independent audit.
If your buildings run on remote-controlled units and you want per-room data and central scheduling without replacing the equipment, that is the job smart classroom climate control for schools was built to do.
FAQ
What Is a Good CO2 Level in a Classroom?
Below 1,000 ppm during occupied hours. UK school guidance caps mechanically ventilated classrooms at 1,000 ppm and rooms relying on windows at 1,500 ppm. Sustained readings above 1,500 ppm mean too little outdoor air is reaching the room.
Can a Classroom Be Too Cold?
Yes. The penalty lands on accuracy rather than pace, and controlled experiments have found cold discomfort hurting learning performance more than warm discomfort of the same intensity. Schools chasing an aggressive summer setpoint can overshoot into a range that costs precision on written work.
Does Humidity Affect Learning in the Classroom?
Indirectly. Relative humidity between 30% and 50% holds mold and dust mites down, and the 40% to 60% band inactivates many respiratory viruses. Humidity is also one of the six factors ASHRAE 55 uses to define comfort, so a muggy 77°F room sits further from comfort than a dry one.
Do Open Windows Improve Classroom Air Quality?
They lower CO2 when wind and the indoor-outdoor temperature gap cooperate, which is often not when you need them. Open windows fight the heating and cooling, and near busy roads they can raise particulate while cutting CO2. Treat them as a fallback rather than the ventilation plan.
Do Air Purifiers Work in Classrooms?
For particulate, yes. Classrooms running purifiers have measured roughly 35% lower PM2.5 and PM10 than those without. Purifiers do nothing to carbon dioxide, which only leaves with outdoor air, so a room can filter all day and still sit at 2,000 ppm.
How Often Should Classroom Air Quality Be Tested?
Ventilation is a stable property of a building. Estimates from consecutive spring terms across 27 schools correlated at 0.79, so a thorough audit holds up for a while. Daily conditions swing with occupancy and equipment faults, which is what continuous logging catches.