




























Key Takeaways
- Ego depletion, the mechanism behind the best-known store temperature study, came out close to zero when 23 labs tested it with 2,141 participants.
- Warmth priming, the mechanism behind the other one, failed three high-powered replications, and a 2023 review pooling 4,577 people came back null.
- We could find no direct replication of either original study, in either direction. They aren't debunked. They're untested.
- The staff curve that puts peak performance at 21.8°C fell over in 2021, when a team rebuilt it against 358 data points, got an R² of 0.02, and recommend against using it at all.
- Performance does fall apart at genuine extremes, by roughly 14% above 32.2°C on the wet bulb globe index. No shop floor runs there.
While researching ambient temperature for a 2012 paper, two marketing academics surveyed 32 local stores. Readings ran from 72°F to 80°F. One store out of the 32 had a temperature guideline of any kind. When the researchers asked managers directly about warm versus cool conditions, 11 of them described the same thing, less time spent in store, less money spent, more complaints. The authors filed the exercise under anecdotal evidence, which is the honest label for it.
We went looking for the research that should have given the other 31 stores a number to work from. It isn't there.
Not for shoppers, where the two studies everyone cites rest on theories that collapsed after publication. Not for staff, where the best-known model was pulled apart in 2021 by the people best placed to check it. Setting your in-store customer experience by a number you read in an article means trusting something nobody has been able to reproduce, and repeating those numbers would make us part of the problem.
All You Need to Know About Temperature and In-Store Customer Experience
- The Study That Says Warm Stores Cost You Sales
- The Temperature Premium and What Shoppers Say They'd Pay
- Ego Depletion, Warmth Priming, and the Replication Crisis
- Does Store Temperature Affect Staff Performance?
- The Six Factors of Thermal Comfort, and Who Controls Them
- Why One Store Needs Five Different Setpoints
- Store Humidity and the 30% to 50% Range
- Your Own Store Data Beats Any Published Number
- Where Sensibo Airbend Fits
- FAQ
The Study That Says Warm Stores Cost You Sales
Amar Cheema and Vanessa Patrick built five studies around a deliberately narrow band, 67°F to 77°F, the range people meet in real stores rather than heatwave conditions.
They opened with a year of daily lottery sales from St. Louis County, running July 2006 to June 2007. Scratch tickets, which make a buyer choose between six options, lost $594 in sales for every 1°F the daily average rose. Set against average daily scratcher sales of $235,737, that's roughly a quarter of a percent per degree. Lotto, a single-option game, showed nothing. Power Ball, also single-option, lost $143 per degree, so the accurate version is that temperature bit harder on the complicated games rather than sparing the simple ones.
The lab studies were all 2x2 designs, and the temperature effect only appeared in half of each grid. Participants were either mentally drained beforehand or they weren't.
- Undrained participants in the 67°F room found 14.95 of 20 planted typos. In the 77°F room, 10.41. Among participants already drained, the pattern reversed.
- Each participant saw one voice recorder, not two side by side. Cool participants rated a pen-shaped one higher on purchase likelihood than a conventional one (3.59 against 2.27). Warm participants went the other way (3.00 for the conventional against 2.14).
- Choosing between two cell phone plans where the cheaper option surfaces only if you do the arithmetic, 59% of undrained cool participants chose correctly against 27% of warm ones. Among drained participants the gap disappeared.
Worth noting what the recorder study shows. Warm participants leaned toward the familiar product rather than toward nothing. No study in the paper measured anyone abandoning a purchase, which is worth remembering next time you read that heat costs you sales.
The Temperature Premium and What Shoppers Say They'd Pay

Yonat Zwebner, Leonard Lee and Jacob Goldenberg named the opposite effect the temperature premium. Their ambient study set a room roughly 4°C either side of 22°C and asked 98 students what they'd pay for 11 products. The warm room drew 10.4% higher stated willingness to pay on average. No money changed hands. Nine of the 11 products pointed the right way, though only three cleared significance individually, and a massage and a Gap T-shirt went the other direction.
The detail everyone quotes, warm participants judging a pen to sit 29.81 cm away against 38.03 cm for cool participants when it was 40 cm away in both conditions, came from a different manipulation. That study had people hold a therapeutic pad at 45°C or 12°C for ten seconds. It says nothing about room air.
Their field study gets quoted at retailers most often and fits retail least. It covers 6.4 million clicks on an Israeli price-comparison website, regressed against outdoor daily temperature. Online shoppers, outdoor weather, standardized coefficient of .026. The bend in the curve that people cite when they say the effect flattens at higher temperatures sits at p = .099, which is not significance.
Ego Depletion, Warmth Priming, and the Replication Crisis
Neither paper explains itself through temperature. Each leans on a borrowed theory, and both theories were taken apart afterwards.
|
The finding retailers quote |
The theory holding it up |
What testing did to that theory |
|
Warm rooms push shoppers off hard decisions (Cheema and Patrick, 2012) |
Ego depletion, using the standard 1998 manipulation |
A 23-lab preregistered replication with 2,141 participants found an effect indistinguishable from zero |
|
Warm rooms raise what shoppers will pay (Zwebner and colleagues, 2014) |
Warmth priming, with the pad studies borrowing their manipulation from the 2008 hot-coffee experiment |
Three high-powered replications of that experiment (n = 861) failed in every lab and in combination. A 2023 review pooling 80 effect sizes across 4,577 people found no reliable effect on the prosocial and antisocial behaviours measured |
Neither the lottery paper nor the temperature premium paper has been directly replicated. We looked and found nothing. So the fair statement is not that they're wrong. It's that they're single-lab findings with 46 to 128 people per study, from before preregistration was normal, resting on theories that later fell over. Anyone quoting a store setpoint from them is quoting something nobody has checked.
Does Store Temperature Affect Staff Performance?
This is where we expected to land on solid ground, and didn't.
The curve everyone reaches for comes from a 2006 Lawrence Berkeley National Laboratory paper. It pooled 24 studies, put peak performance at 21.8°C, and showed performance dropping to 91.1% of maximum by 30°C. It sits in the ASHRAE Handbook. It has hundreds of citations. Earlier drafts of this article used it.
In 2021 a team from Berkeley, Denmark's Technical University and the National University of Singapore went back and checked. They rebuilt the model and tested it against its own source data, and it explained 5% of the variance. Then they built a larger database, 35 studies and 358 normalised data points covering 1,134 adults, and tested it again. It explained 2%. They tried linear and quadratic regression, machine learning, and the Maximal Adaptability framework. Nothing outperformed a zero-order model that assumes temperature does nothing whatsoever.
Their recommendation is blunt. Don't use any of these models in practice, the 2006 one included.
The 21.8°C peak has a further problem. It's an artifact of fitting a quadratic. The reviewers point out that a linear fit of the same data, with a difference in explained variance under one percent, moves the optimum to 23.1°C.
Something does survive, but only at the edges.
|
Temperature |
What the pooled evidence shows |
Source |
|
20°C to 30°C, where 90% of office buildings sit |
No relationship with work performance |
Porras-Salazar et al., 2021 |
|
18°C to 34°C |
Nothing across the wider range either |
Porras-Salazar et al., 2021 |
|
Above 32.2°C wet bulb globe |
Decrement of about 14.9% |
Pilcher et al., 2002 |
|
At or below 10°C wet bulb globe |
Decrement of about 13.9% |
Pilcher et al., 2002 |
A separate meta-analysis of 528 effect sizes agrees that thermal stress carries a substantial penalty, with heat and cold comparable overall and cognitive tasks the least affected of anything measured. Both papers work in occupational stress ranges. Your stockroom in August is not one.

The Six Factors of Thermal Comfort, and Who Controls Them
Two independent sources now point at the same explanation, and it's the useful part of this whole topic. A single temperature is the wrong instrument.
ASHRAE Standard 55, the reference for thermal comfort in occupied buildings, declines to name a temperature. It works through six factors instead, and only four of them are yours.
|
Factor |
Who sets it |
|
Air temperature |
You |
|
Thermal radiation |
You, through glazing, lighting and solar gain |
|
Humidity |
You |
|
Air speed |
You |
|
Clothing |
The shopper |
|
Activity level |
The shopper |
Land the combination and more than 80% of people in the room are satisfied. Around 40% of building occupants report dissatisfaction with their thermal environment, which says how often it gets missed. The 2021 reviewers arrived at the same place from the other end, that temperature alone may not describe how the thermal environment affects the people standing in it.
Your shopper is in a winter coat, carrying bags, walking. Your cashier is in a branded polo standing still. Same air, same reading on the wall, two different comfort zones.
The standard's own commentary adds something that lands harder in retail than anywhere else. It describes comfort in a steady state only, and notes that people arriving from different conditions outside may not find a compliant space comfortable straight away, with prior exposure shaping comfort perception for around an hour. That's longer than a lot of shopping trips, so much of your traffic never reaches the state your setpoint was designed around. You're managing an arrival, not a destination.
That arrival is also what brings people in. A credit card transaction analysis across Seoul found brick-and-mortar sales rose 4% during heatwaves above 35°C and 11% during cold spells below −15°C, which the authors put down to people seeking out temperature-controlled space and buying thermal comfort once inside. When the street turns hostile, the shopper experience starts as a physical one.
Why One Store Needs Five Different Setpoints
The wall reading is a single number describing a space that behaves like five, and this part needs no contested psychology at all.
|
Zone |
What drives the load |
Why one setpoint fails it |
|
Threshold |
Doors opening onto outside air |
Never reaches target while the door cycles |
|
Sales floor |
Occupancy, lighting, solar gain |
The only zone the setpoint was ever chosen for |
|
Fitting room |
Hot lights, poor airflow, small sealed volume |
Runs warm with nowhere to shed it, at the moment the decision gets made |
|
Checkout queue |
Bodies standing still in a cluster |
Warms exactly when you're busiest |
|
Stockroom |
Almost nothing |
Conditioned all day for shoppers who never walk in |
The threshold is the one that turned into a legal question. Ventilation alone accounts for 18% of end-use consumption in non-mall retail, which is the scale of air you're already paying to move before anyone props a door open. Administrative Code § 20-910 makes it unlawful in New York to keep an exterior door or window open while air conditioning runs the adjoining space, with carve-outs for people coming and going, deliveries and emergencies.
Five loads, five schedules, and in most stores one remote pointed at whichever unit someone last stood next to. Splitting them into separately controlled zones is the practical work that smart HVAC for retail stores exists to do.
Store Humidity and the 30% to 50% Range

Air speed and humidity are two of the six factors in Standard 55, and humidity is the one that quietly makes a correct setpoint feel wrong. Your body sheds heat by evaporating sweat, and damp air slows that down.
The EPA guidance is a mould and moisture rule rather than a comfort rule, so treat it that way. Keep relative humidity below 60%, ideally 30% to 50%. Cross 60% and mould becomes a live risk on any organic surface that also has dust on it, which in a store means stock as often as structure.
It's the rare number in this topic that comes with a clear threshold and a clear reason, which makes it the first thing to instrument rather than the last. Retail customer satisfaction surveys catch humidity complaints as vague dissatisfaction that never becomes a work order, which is how an in-store experience degrades for months with nobody able to name what's wrong.
Your Own Store Data Beats Any Published Number
Every published number in this topic comes from someone else's building, someone else's shoppers, someone else's climate. Mostly from students in a lab, mostly a decade or more ago, and the two biggest attempts to turn that pile into a usable curve both concluded that it can't be done from temperature alone. Your stores are generating better data than any of it, every day, and nobody is reading it.
That's the real finding in the 32-store survey. Not that 72°F to 80°F is wrong. That 31 of 32 had no guideline, which means no baseline, no comparison, and no way to tell if the complaints in store 12 trace to the air or to the queue. Staff hold the remote, they're the only people there for the whole shift, so the setpoint drifts toward what suits them and it drifts differently in every location you own. Turning that drift into something visible and enforceable is ordinary retail operations management, and it's the step most chains skip.
Anyone working out how to improve customer experience in retail stores at scale hits this before they hit anything else. You can't A/B test a setpoint you can't see, and you can't hold a policy you can't measure against.
Where Sensibo Airbend Fits
Getting to your own numbers takes zone-level control, a system that reacts when conditions move, and something that stops the entrance bleeding.
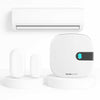
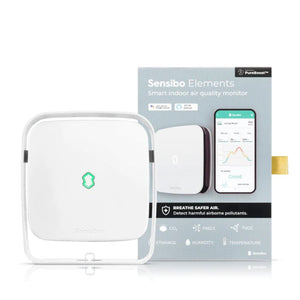
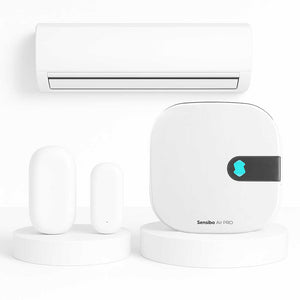
Sensibo Airbend runs every location from one centralized dashboard, which turns a regional policy into something you can hold rather than a habit that varies by store. Zone-based smart scheduling gives the sales floor, the till and the stockroom their own hours and targets. Climate React adjusts units automatically as temperature and humidity move instead of waiting for someone to notice. Door and window sensors pause air conditioning when a door is left open, which covers both the energy bleed and the reason the front of your store never reaches its number.
FAQ
Where Should You Measure Store Temperature?
Not where the controller happens to hang. Standard 55 takes air temperature as the average of ankle, waist and head level, which for standing occupants means 0.1, 1.1 and 1.7 m (4, 43 and 67 in.), with operative temperature read at 1.1 m. A single sensor at mounting height is measuring one point that appears nowhere in that calculation.
How Long Does a Reading Need to Run Before It Means Anything?
Standard 55 asks for measurement periods spanning two hours or more, sampling the hours the space is genuinely occupied rather than a convenient slot, with readings taken at intervals of five minutes or less. A spot check on a walkthrough tells you about one minute in one spot.
Should the Setpoint Change Between Summer and Winter?
Standard 55's adaptive model says yes, and pins allowable indoor temperature to the average outdoor temperature across the previous 7 to 30 days rather than to the calendar. It applies only where people can adjust clothing across a range of at least 0.5 to 1.0 clo, and where the prevailing outdoor mean falls between 10°C and 33.5°C (50°F and 92.3°F).
Is There a Legal Minimum or Maximum Temperature for a Shop?
In the US, no. OSHA has no temperature standard and recommends 68–76°F as guidance, enforcing through the General Duty Clause only when heat or cold becomes a recognised hazard. In the UK the regulations name no maximum and no statutory minimum, though the Approved Code of Practice puts retail work at 16°C or above.
Why Do Complaints Cluster in One Part of the Store?
Standard 55 treats this as local thermal discomfort, which is assessed separately from the room average and can fire while the average looks fine. It caps the ankle-to-head air temperature difference on the basis that no more than 5% of occupants should be dissatisfied by vertical stratification, and handles draughts and floor temperature on the same logic.