
































Key Takeaways
- HVAC remote monitoring pulls runtime, setpoint, temperature, and consumption data off every AC unit in a portfolio and puts it in one place, without replacing equipment
- Detection is rarely the failure point. Berkeley Lab logged eighteen air handler fault types that kept being reported for over 20% of the period it studied, all on equipment that already had monitoring
- Six readings carry most of the diagnostic weight, and unoccupied-hours runtime is the one that pays for the system fastest
- Raw kWh comparisons between sites are close to meaningless until you normalize for square footage, degree days, and operating hours
- Split systems, PTACs, and window units run on infrared remotes with no terminal a building management system can wire into, which leaves the bulk of a distributed portfolio outside building automation
One hospital in Berkeley Lab's HVAC fault prevalence study ran 47 air handlers and 818 terminal units. Over a single 365-day period, its fault detection software logged 443,308 daily fault records across 34 distinct fault types.
That's about 1,215 fault records a day, arriving at a facility that had already bought monitoring. Sensors on the equipment, software watching the sensors, and a screen somewhere showing the output. Somebody was supposed to read those.
That's the part most conversations about HVAC remote monitoring skip. Seeing the problem was solved years ago. Almost every multi-site operator we talk to can already see more than the team can act on.
So the question worth your time is what to look at first, how to tell one site's numbers from another's honestly, and what to do on the Monday when the queue holds more alerts than two people can read.
All You Need to Know About HVAC Remote Monitoring
- What HVAC Remote Monitoring Sends Back From Each Unit
- Why Faults Survive for Months on a Monitored System
- The Six Readings That Matter Before Anything Else
- Comparing Store 12 to Store 14 Without Fooling Yourself
- Fault Signatures You Can Read Without a Technician
- How to Keep Alerts From Becoming Noise
- Most Multi-Site AC Equipment Is Invisible to a BMS
- The Diagnosis Still Needs Somebody Standing There
- A Rollout Order That Doesn't Waste Your First Quarter
- Monitoring Every AC Unit Across Your Sites With Sensibo Airbend
- FAQ
What HVAC Remote Monitoring Sends Back From Each Unit
HVAC remote monitoring is the continuous collection of operating data from heating and cooling equipment across one or more buildings, delivered to a central dashboard. A controller or sensor at each unit reports temperature, humidity, runtime, operating mode, setpoint, and consumption, so a facility team can assess equipment health without visiting the site.
In practice that's a row per unit with a timestamp every few minutes, carrying room temperature against target temperature, on or off and in which mode, runtime so far, and the last command sent along with who sent it. An AC monitoring system built on retrofit controllers adds indoor humidity, plus CO2 and particulate readings where air quality sensors are in the mix.

None of that is exotic, and every vendor collects roughly the same fields. Portfolios that save money and portfolios that don't diverge later, once the readings land in front of somebody.
Why Faults Survive for Months on a Monitored System
That hospital was not an outlier. The study it came from pulled multi-year fault detection records from more than 60,000 pieces of commercial HVAC equipment covering over 90 fault types, and the findings are uncomfortable for anyone selling detection as the answer.
❗ On any given day across the dataset, 40% of air handling units and 30% of air terminal units had at least one fault reported against them. Twenty-one separate air handler faults were reported on a fifth or more of all AHUs, and eighteen AHU faults stayed reported across more than a fifth of the period the data covered. (Berkeley Lab, 2023)
The equipment in that study was ducted commercial gear, air handlers and terminal units and rooftop packages, rather than the split systems that fill a retail or hotel portfolio. The mechanism carries across anyway, because the bottleneck it exposes is human attention. Across the 317 buildings sampled, the mean was 245 reported faults per building per month.
Negligence has little to do with what happens next. Flag every deviation on every unit across forty sites and you hand a facility manager more alerts than any person with other responsibilities can triage. Ignoring them becomes the only workable response. Once a team learns most alerts need no action, the ones that do get ignored alongside them.
Berkeley Lab's separate meta-analysis of roughly 1,500 commissioned buildings puts money against that. Among projects run through utility programs, standard existing-building commissioning returned a median 5% primary energy saving while monitoring-based commissioning returned 9%. Commissioning done outside utility programs altogether returned 14%, beating both. Read the three together and the ranking is awkward for anyone selling a dashboard, because the best result came from the projects with no monitoring requirement attached and the most thorough scope. What continuous data buys is the ability to keep doing that work at portfolio scale without sending an engineer to every building, which is a smaller claim than most vendors make and an easier one to keep.
The Six Readings That Matter Before Anything Else
Start with runtime, and read it against occupancy. Everything else is refinement.
A platform will happily show you thirty metrics per unit. Six will find most of what's wrong in a commercial portfolio, and a team checking those six weekly beats a team drowning in the full set.
|
Reading |
What it tells you |
What a bad number looks like |
|
Runtime hours per unit |
Total demand on the equipment, and your baseline for every other comparison |
One unit running 30% longer than identical units in the same building |
|
Unoccupied-hours runtime |
Conditioning delivered to empty rooms, the single largest recoverable waste |
Any meaningful runtime between closing and opening, or across a school holiday |
|
Setpoint versus actual temperature |
How well the unit keeps up with the load it was given |
A persistent 4°F (2°C) gap that never closes during operating hours |
|
Cycle length and frequency |
Compressor stress and short-cycling, an early warning on capacitors and charge |
Cycles repeatedly ending inside 10 minutes, against a usual two or three per hour |
|
Estimated consumption per unit |
Cost attribution by unit, floor, or site |
A unit drawing more this July than last July under similar weather |
|
Last report received |
Data, or silence you mistook for data |
A unit that stopped reporting and nobody noticed |
That last row catches more people than it should. A controller loses WiFi during a router swap, the unit disappears from the dashboard, and because failure shows up as absence instead of an alarm, the site runs unmonitored for weeks. Any HVAC monitoring setup worth paying for treats silence as a fault condition.
Of the six, we'd hand a team unoccupied-hours runtime on day one. It costs nothing to act on and needs nobody qualified. You look at what ran overnight, and you turn it off.
Comparing Store 12 to Store 14 Without Fooling Yourself
Multi-site work diverges from single-building work right here, and it's where most dashboards quietly mislead people. Ranking sites by raw kWh tells you which of your buildings are large and which sit in hot climates. It says nothing about which are managed badly. The biggest consumer in a portfolio is often the best-run site in it, carrying the most square footage in the hardest weather.
Say Store A burned 12,400 kWh last month and Store B burned 9,800. Store A looks like the problem, and it used 27% more electricity to prove it.
Now divide each by conditioned square footage and by cooling degree days for that site's own weather station, which NOAA publishes by station at base 65°F through its climate normals.
- Store A. 12,400 kWh across 5,600 sq ft against 410 degree days, which lands at 5.4 kWh per 1,000 sq ft per degree day.
- Store B. 9,800 kWh across 3,100 sq ft against 520 degree days. That's 6.1.
Store B is the worse operation by roughly 13%, and the raw number sent you to the wrong building. Figures here are illustrative, but the arithmetic is the arithmetic.
Add operating hours as a third divisor once schedules diverge, which happens the moment you mix store formats or bring a school calendar into the portfolio. Keep comparisons inside like-for-like groups too. Measuring a hotel against a warehouse produces a number with nothing behind it.
Once sites are ranked this way, the bottom of that list is where the next quarter's work lives. For building-level benchmarking against national peers rather than against each other, energy-efficient HVAC for commercial buildings covers EUI and ENERGY STAR Portfolio Manager in detail.
Fault Signatures You Can Read Without a Technician
You don't need refrigeration training to recognize these four patterns in a smart AC monitoring system. Each one has a shape that shows up in runtime and temperature data, and each one tells you what to say when you call the service contractor.
Short Cycling
The unit starts, runs a few minutes, stops, starts again. On the runtime graph it looks like a picket fence. An oversized unit does it. So does a dirty filter, or a low refrigerant charge, and the compressor pays for all three. This is the pattern most worth escalating quickly, because the failure it leads to is expensive.
Never Reaches Setpoint
Room temperature sits several degrees above target while the unit runs continuously. The equipment is working and losing. Look at filters and coils first, then at what changed in the space, because a room that used to hold setpoint and now can't has usually gained heat load, not lost capacity.
Runs Through Every Closed Hour
Flat, uninterrupted runtime across nights, weekends, and holidays. No fault code, no complaint, no alert on most systems, since nothing is mechanically wrong. It's the largest line item here, and no technician can fix it. The schedule can.
Setpoint Drift
The target temperature at a site keeps creeping down through the week and resetting after your team visits. Somebody with access to the remote is fighting the schedule. The data tells you which site and roughly when. A policy limit closes it in about a minute.
How to Keep Alerts From Becoming Noise
Given what happens to detection at scale, alert design deserves more attention than most HVAC monitoring rollouts give it.
Sort every alert your platform can generate into three tiers, and route each tier differently.
- Act today. Equipment offline, unit failing to reach setpoint in an occupied space, short cycling above threshold. Goes to the person who can dispatch a technician.
- Review weekly. Consumption outliers, cycle counts trending up, unoccupied runtime creeping back. Collects in a Monday review list.
- Log only. Everything else. Visible when someone investigates, silent otherwise.
Set thresholds against peer units wherever you can, not against absolute values. When one unit runs 40% longer than the eleven identical units around it, that's a signal worth acting on. Crossing some fixed hourly runtime usually just means a busy room.
Then suppress duplicates ruthlessly. One alert per fault per unit per day. A site that loses power should generate one notification, not sixty.
For most teams the weekly outlier review does more work than real-time alerting. It has a stopping point, which is the thing real-time alerting never has, and it fits inside a meeting that already exists.
Most Multi-Site AC Equipment Is Invisible to a BMS
A building management system reads equipment it can wire into. Rooftop units, air handlers, chillers, VAV boxes. The distributed cooling equipment in retail stores, hotel guest rooms, classrooms, and branch offices is usually a mini-split, a PTAC, a window unit, or a portable, and every one of those is controlled by an infrared remote. There is no wiring terminal for a BMS to connect to. The unit is mechanically fine and digitally invisible.

That gap explains why a chain can run a capable HVAC control system at head office and still have no idea what the AC in store 14 did last night. Expanding the BMS is rarely the fix either, since replacing equipment costs more than the problem and full building automation prices out of reach across dozens of small sites.
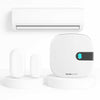
A retrofit controller sits in front of the existing unit, speaks the same infrared language as the remote, and becomes both the monitoring point and the control point. Our guide to smart HVAC systems for commercial buildings walks through how that software layer works alongside an existing BMS instead of replacing it.
The Diagnosis Still Needs Somebody Standing There
We'd rather you hear this from us than discover it in month three.
Remote monitoring shows you a unit working harder than it should. It doesn't tell you why. Refrigerant charge, coil fouling, duct leakage, a failing capacitor, and a room that gained six new laptops all produce similar patterns in runtime data. Narrowing that down still requires gauges and someone standing in front of the equipment.
Consumption figures deserve their own caveat. A controller sitting beside the unit and talking to it over infrared is not a revenue-grade meter on the unit's circuit, so read those kilowatt-hour numbers as good for ranking units against each other and tracking change over time, which is what portfolio work needs. Don't bill a tenant off them.
So instead of sending a technician to a site to look around, you send one to a named unit with a described symptom.
A Rollout Order That Doesn't Waste Your First Quarter
The most common mistake we see is switching on automation the same week the hardware goes in. It feels productive and it costs you your baseline, because from that point forward you cannot separate savings from weather, occupancy, or anything else that changed.

- Instrument everything before changing anything. Get controllers on every unit across every site, confirm each one reports, and leave the settings alone.
- Collect four to six weeks of untouched data. This is your before. Without it, no savings claim you make later will survive a finance review.
- Rank sites on normalized consumption. Square footage, degree days, operating hours. Three sites will stand out, and they are where you start.
- Fix the free things first. Unoccupied runtime and setpoint limits, plus whatever scheduling gaps the ranking exposed. No capital required, and the return arrives fast enough to fund the rest of the program politically.
- Escalate the mechanical outliers. Short cycling and setpoint failures go to the contractor with the data attached.
- Automate last. Once you know what each site does, schedules and policies enforce what you learned instead of guessing.
Monitoring Every AC Unit Across Your Sites With Sensibo Airbend
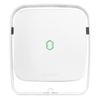
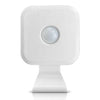
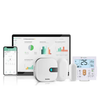
Sensibo Airbend is our commercial platform for the equipment described above. Plug-in controllers attach to any air conditioner or heat pump running on an infrared remote, covering 10,000-plus models, and go in under a minute per unit with no wiring and no downtime for the room.
One dashboard then carries live status across every site, runtime and consumption by unit or zone, a map view for spread-out portfolios, bulk actions on hundreds of devices at once, and policy limits that stop a manual override at one store from undoing the plan. An open API feeds the same data to a BMS or property management system if you run one.
7-Eleven Hong Kong runs Airbend across 300-plus stores, and the ORT Bialik educational network reports a 28% cut in AC bills across more than 100 classrooms. Our own figure for energy cost reduction is up to 40%. Treat that as our number, and test it against the baseline you collect in your first six weeks.
Book a demo and we'll go through your site list and what the data would look like across it.
FAQ
Does HVAC remote monitoring need internet at every site, and what happens when a site drops offline?
Cloud platforms need WiFi at each location. When it drops, controllers generally keep running their last schedule locally, so cooling continues while visibility and remote control stop. Set the platform to alert on missing data, not only on faults, since a silent site looks identical to a healthy one on most dashboards.
Can we monitor units from different manufacturers on one AC monitoring system?
Yes, and mixed fleets are the normal case in any portfolio built through acquisition. Infrared controllers learn the command set of each unit's remote, so brand and age matter far less than having an IR remote at all. Confirm model coverage for anything unusual before you commit.
How long before monitoring data is useful enough to act on?
Runtime anomalies and offline units surface within days. Site-to-site comparison needs four to six weeks, since you need enough weather variation to normalize against. Seasonal patterns take a full cooling season, which is why year one of any program saves less than year two.
Who should receive HVAC alerts, the facility team or the service contractor?
Split by tier. Anything needing a truck goes to whoever holds the service contract, with the unit ID and symptom attached. Scheduling, setpoint, and policy issues stay in-house, since those need no technician and a contractor has no reason to fix them. Sending everything to both is how alert fatigue starts.
Can a monitoring platform feed data into our existing HVAC control system or BMS?
Most commercial platforms expose an open API for this, and it's the standard approach when a BMS already manages central plant but sees nothing of the distributed split systems. Ask for the API documentation during evaluation rather than after purchase, and check granularity, since some vendors return daily summaries instead of the per-unit detail that makes the integration worth building.